Forecasting & Resource Management
Discover how the Forecasting & Resource Management Tool can benefit your organization.
Forecasting & Resource Management

Managing the availability of resources is a critical element for project managers. Scheduling tools can provide accurate, detailed forecasting of when and which resources are required for a given project. But information on when and how many resources are available is not data that can be effectively managed in most COTS scheduling tools. Labor resource data such as skill sets, worker availability, vacation schedules, and departmental affiliations are typically found in accounting and Human Resource databases. There are many COTS software products that attempt to assist with resource allocation and management, but these systems do not fully integrate with project scheduling tools or HR applications.
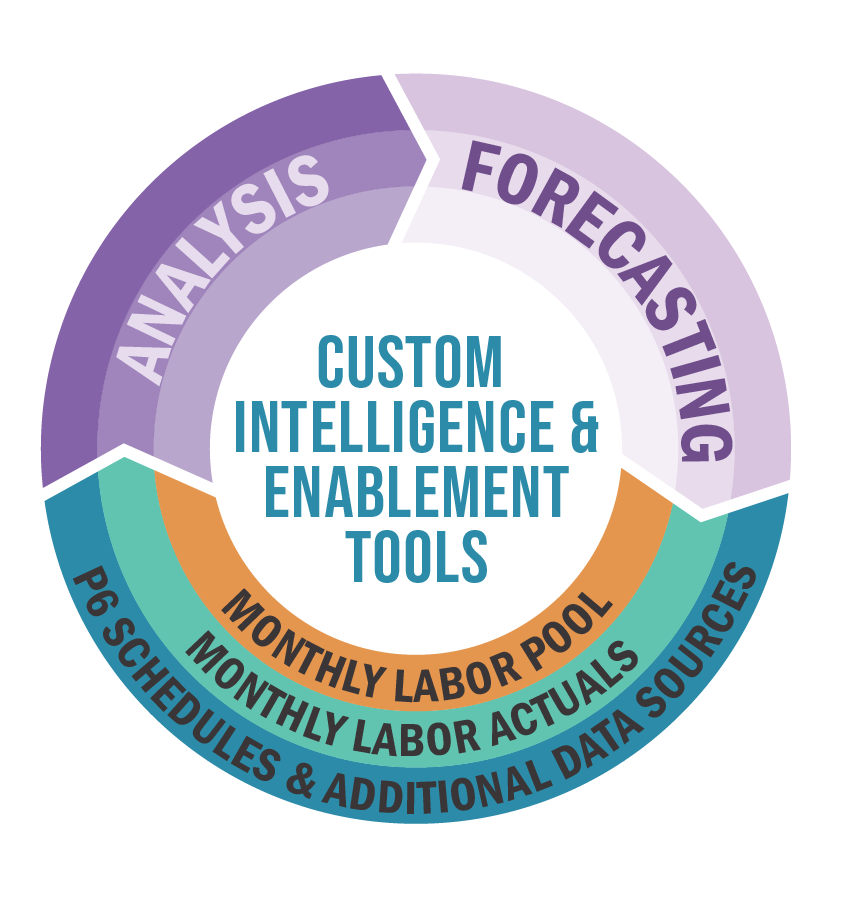
PMWorks seeks to address these gaps by building tools that compare the demand-side data from project schedules, with the supply-side data in HR and Finance/Accounting tools. We assist our clients in building out data structures that focus on their business needs, creating resource categories to identify skillsets and other important attributes, and layering in forecasted demand from current and future projects. The client is then able to compare forecasts with current supply, and propose adjustments and additions that can fill recognized gaps. This may include moving people across departments, delaying or accelerating certain project activities, or identifying the need for additional hiring.
These tools can be deployed quickly in most cases, and can be customized to the client's specific workforce and industry requirements. And unlike with COTS applications, when those requirements evolve, PMWorks' tools can be changed to keep in alignment. The client owns the tool and can make changes and modifications whenever needed.
Key Features
Modular codebase for flexibility in application-specific needs
Seamlessly scalable to efficiently accommodate growth
User management with access levels and customizable user profiles
Admin pages to manage user access, WBS and database mappings
Import from major platforms including PeopleSoft, P6, and MS Project or Excel
Management of actual reported labor and projected labor requirements
Visualizations include interactive line and horizon charts to show trends
Feature-rich, editable data tables with custom pivot tables for in-depth analysis
Customized reports that highlight trends and patterns in the data


